Showing posts with label representation. Show all posts

Thursday, February 7, 2013

Infographic First Look

Yikes. I'm nervous to post this! But I want to get some feedback before submitting my final project.

Please be kind. :)

P.S. Sorry I uploaded it so big. It is designed to be a 11 x 17 poster, and you couldn't read a lot of it when it was smaller. Just "Open image in new window/tab" and then you should be able to read it there (without my profile text obstructing the view.


Friday, February 1, 2013

Reflection: Infographics: Visualizing Relationships

I've already watched the First and Second of the infographic series on Lynda.com, so I figured I should go ahead and watch the last in the series: Visualizing Relationships.

The main point of this video is to teach someone how to make a Radial chart to show relationships between multiple entities.

This was interesting to me, because I had never made a radial chart before.

While watching the video, I actually started thinking of how I could use a radial chart to depict the relationships between the Central Asia languages and the US universities that teach them. This was actually an aha moment for me, because before watching this video, I wasn't sure how I was going to depict this information.

Thursday, January 31, 2013

Catch Up Week Reflection: Infographics: Area Bubbles

While working on my infographic, I was having difficulty thinking of unique and interesting ways to show my data (instead of just using bar graphs over and over). This led me to Lynda.com's tutorial on Infographics: Area Bubbles.

The presenter, Shane Snow, shows you how to create good and accurate visual representations of information for your infographics.

He explains the importance of not just eye balling visual representations (bubbles, etc), but actually making sure that your visual representations are in proportion to one another. To do this, you actually use Excel and some mathematical formulas to come up with the right proportions. (He clearly explains how to come up with the right #s!)

Note: I likely won't be using circles...I'm hoping to use some kind of glyph (like a camel). I'm thinking I do the same thing by using percentages... For instance, if my biggest camel represents 25 universities, and I have another camel representing 5 universities, I should be able to use Image>Scale> and then Scale down 20%, since 5 is 20% of 25. I will have to play around with this.

Then he opens up Photoshop and shows you how to draw a couple of circles according to the right diameter size (that you found when doing the calculations for proportion) and label each bubble (which he recommends doing as you go, so that you don't get confused later).

Then, he shows how to arrange and add details, making the image is more visually interesting.

Even though the content (making bubbles) isn't directly related to my content, the overall message of using proportions and then adding detail and flare to create an artistic style to fit your content/subject matter and own aesthetic sense is transferable to anyone and any infographic.

Later tonight, I will probably watch the last tutorial in the series. Because I hope to start drafting my infograph design tonight or tomorrow.

Sunday, January 27, 2013

W4: Infographic Storyboard


Title: Critical Languages of the Central Asian Region

Purpose / Goal: To educate and inform
This infographic will focus on educating and providing information about the critical languages (as deemed by the US Department of Education) in Central Asia. It’s main purpose will be to act as a marketing tool for a center whose mission is to disseminate information about Central Asian languages. The audience of the information are people who are unfamiliar with the languages of the region.

Narrative Description of Content and Design:


The infographic will be based on a 11"x17" poster size and will be divided into 4 sections:
•Languages spoken in Central Asia by country and population of speakers of languages by country
•Overall population of speakers of each language
•Types of writing systems used for each language (Arabic script, Cyrillic, Latin, other, etc)
•The numbers of American universities that offer classes in each language

To gather this data, I will use the U.S. Department of Education’s List of Critical languages, census reports for the CA countries, and online resources through various university language programs.

The first part, Languages spoken in Central Asia by country, will be represented using a map of Central Asia and a bubble graph will be used to express the population of speakers of the language by country.

The Overall population of speakers of each language will be depicted using bar graphs showing the comparison of populations. (I haven't decided yet if I will split the information into three charts: one for Turkic based languages, one for Persian based languages, and other...I think I'll wait until I start putting the charts together to see how easy it is to read the information.)

For the Types of writing systems, I was planning on doing some kind of Venn Diagram since many of the languages overlap writing systems that they use.

I'm not quite sure how I'm going to show the universities that offer classes. I'm imagining a comparison chart of some kind using glyphs, but I still have to work this out.

The overall design for the poster will use Central Asian colors: like beige, orange, golden, red, etc. and the background/borders will use Central Asian patterns like often seen in tapestries and rugs. For the titles and subtitles, I will use a font called Psuedo Saudi that looks like Arabic script.


Saturday, January 26, 2013

W4: Project Representation

About our Project


Team VidTech2.0 will be conducting an intervention of the design of the training Team VidTech created in Fall R521: CeLTIE Windows Movie Maker Workshop, wherein we created a hands-on, interactive workshop for language learning teachers interested in learning how to use the free movie editing software Windows Movie Maker to edit their own personal video clips.

Part of the feedback we got from the workshop attendees was that they liked the workshop, however, some thought it was too long, some thought it went too fast, not allowing enough practice time. We realized that this was directly related to the learners' own comfort level with technology. Those who were very tech savvy flew through training on their own using the Student Materials. And those who were less tech savvy followed along with the instructor, asking more questions and needing more practice time. Because we cannot predict or control the level of technical familiarity and comfort of workshop attendees, we decided that perhaps the best way to adjust this factor is create a self-paced workshop. If we redesigned the workshop to be delivered via computer based training methods, then learners could complete the objectives at their own pace, while still keeping the interactive elements and engaging active learning.


Project Representation

So now that we have established our intervention and its justification, we must consider our decisions for organizing and representing content.

As related to the actual software instruction of the project, it is very important to be accurate. Using clear and concrete examples of how to complete the tasks via screen captures (both still and video) will be very important. However, we will also be engaging the learner by challenging them to consider why they would use certain elements (captioning, voice over, sound effects, etc), which can be achieved by using more abstract representations, forcing them to think of specific examples.


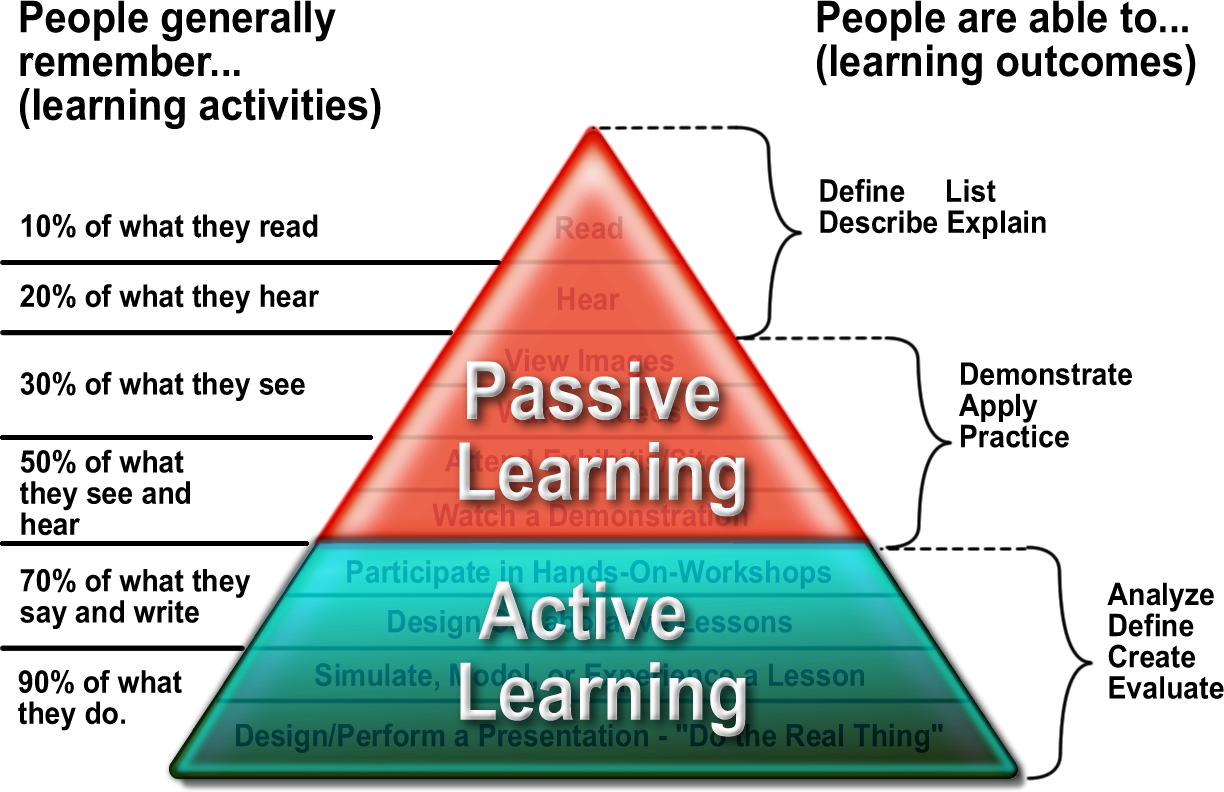
Because of the constraints of the medium in which we have chosen to deliver the content (via online asynchronous website design), there will be a large portion of Passive Learning, reading explanations, observing pictures, watching videos, etc. However, we will also include Active Learning components as well (asking review questions, giving them opportunities to practice in their own windows, etc). By having the learner engage with the content in multiple meaningful ways, our goal is to access their prior knowledge (of both pedagogy principles and software/technology intuitions) and build on them with the knowledge of the new content.

In this training, learner motivation will be a key factor, since the learners will be completing the tutorial independently and self paced. Those learners that push themselves to engage with the content and active practice will get more out of the training than those who chose to passively watch the tutorial, but not engage in the interactive actitivities. And that is something that will be out of our control in the medium selected.