After reviewing tons of infographics, I realized that there are many steps to creating one.
Beginning with: Start with an idea. You need to know the content, like hamburgers.
Then, Decide on the purpose. The content might be on hamburgers, but is the purpose to examine the nutritional value of hamburgers, compare which hamburgers taste the best, explain how to make the perfect hamburger, ask what the most preferred toppings for hamburgers are....?? What is the point of the inforgraphic and what is it meaning to do/and or convey to those who view.
This leads us to my first Great Infographic Design Principle: Know your audience.
I've seen some very graphic heavy infographics that are more flash than content. These would not be seen as valuable for many academics and researchers that value facts and resources. And I've seen some very text heavy infographics that might appeal to an academic, or someone heavily invested in the content, but that many who see it (including me) get overwhelmed by the text and choose not to bother reading. So, infographic content and design developers really need to know their audience and make specific choices based on how to best convey their message and reach the desired target population.
This leads us to my second Great Infographic Design Principle: Use your words wisely.
To me, the worst thing most infographics can do is to be too wordy. Because, while some people (if they are highly invested in the content) might be willing to read paragraphs of text on an infographic, most people are not. Infographics should really use the graphics to tell the story for the most part, and every word in the design should really earn its place there.
I think it's hard to give examples and non-examples for these two related principles, because, as I said before, if you know your purpose and audience, and you know they would want lots of factual information and support, you might want to use more text. But I'll show examples and non-examples of infographics that I believe got it done right or wrong.
Example
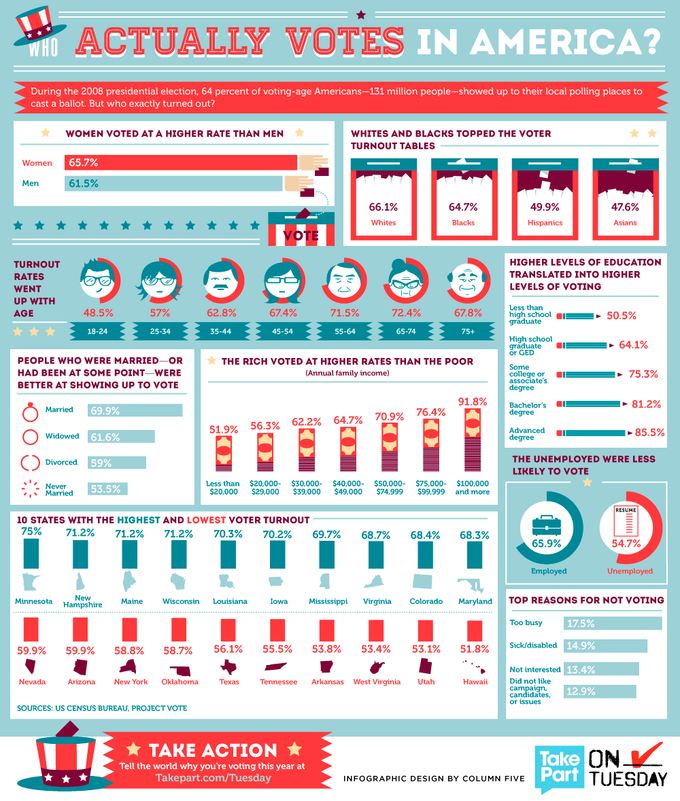 This infographic seems to be reaching a general population. I think it assumes that any and all citizens would be interested in who votes. Therefore I think sticking to short phrases and numbers with clear representative pictures was a smart choice.
I don't feel overwhelmed by the information and my eye can easily see what the different charts and or figures represent.
And, the inforgraphic even lists its sources (US Census Bureau and Project Vote).

My head hurts just looking at this infographic. I don't know WHO the intended audience is, but since it says "Your New Health Care System", let's just imagine for a moment that it is the same audience as the infographic above: the general population; the average citizen.
There is just too much. Too many colors. Too many words. Too much writing. The average person isn't going to read any of this. Well, maybe a few of the big circles, but that is it. Nothing about this graphic makes explaining the new health care system any easier to understand, only harder! If that were possible!

Another example of just too much text is this Evolution of Apple. It's a time line of Apply Macintosh's company and products, but it just looks like a power point slide. A very busy power point slide with too much writing.
This is a perfect example of letting the graphics and minimal text and numbers, do the talking. There is a short paragraph explaining the infographic, but it is not overpowering, and the rest of the infographic uses just words or phrases along with an image to convey the meaning.
Notice this one also provides a clear ledger and a source.
No comments:
Post a Comment